data types
- Scaler - scalers in R are vectors of size 1
- double
- int
- character
- logical (true/false)
- Vector - Vectors are one-dimensional homogeneous data structures.
- array
- matrix
- data frame
>v1 <- c(1, 2, 3)           # Numeric vector
v2 <- c("a", "b", "c")     # Character vector
v3 <- c(TRUE, FALSE, TRUE) # Logical vector
A scalar is treated as a numeric vector of length 1
x <- 5
length(x)  # Output: 1
Declaring vectors
x = c(1,2,3,4,5,6,7,8,9,10); y = c(8,0,4,6,2,10,20,14,8,-9); z = x+y
print(z); [1] 9 2 7 10 7 16 27 22 17 1 min(y) [1] -9 max(y) [1] 20 min(x) [1] 1 mix(y) range_y = max(y) - min(y) [1] 29
ls() [1] “max_x” “max_y” “min_x” “min_y” “range_y” “x” “y” [8] “z”
summary(y) Min. 1st Qu. Median Mean 3rd Qu. Max. -9.0 2.5 7.0 6.3 9.5 20.0
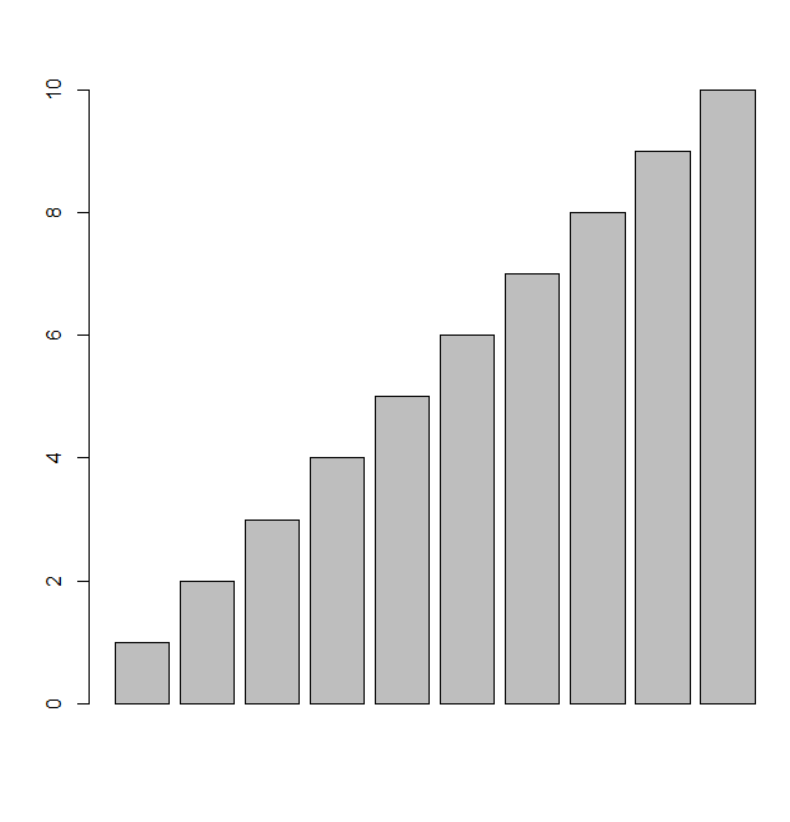
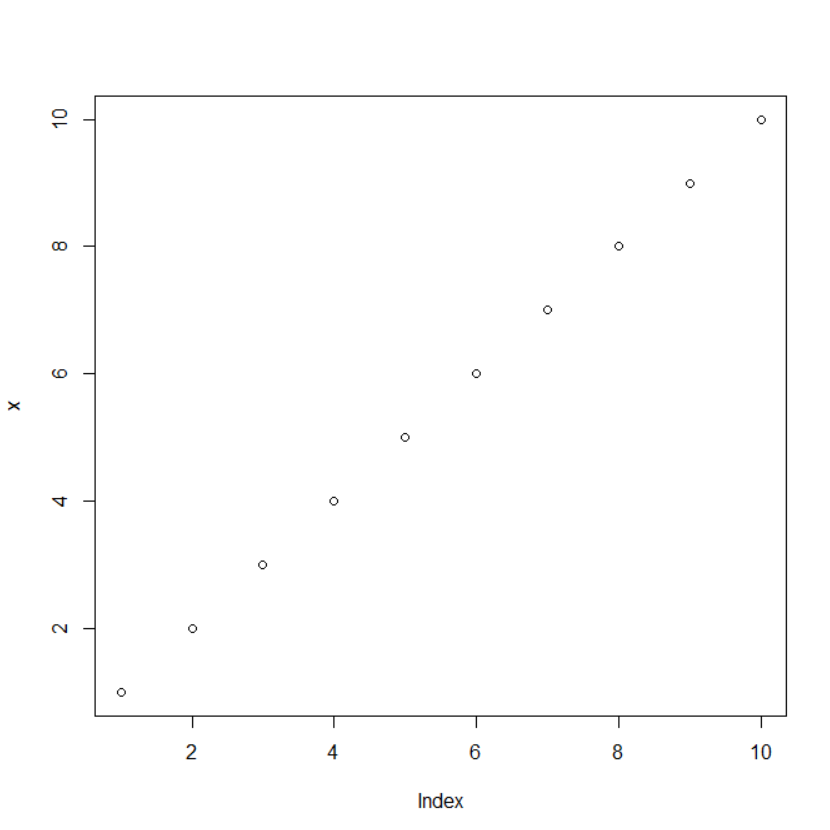
plot graphs
plot(x,y) barplot(x,y) plot(x,y,type=“l”)
write to a text file
When you run your script with Rscript, redirect its output to a file:
Rscript myscript.R > output.txt
-
>overwrites the file every time. -
Use
>>to append instead:Rscript myscript.R >> output.txtOR
sink("output.txt")     # Start capturing console
.
.
.
sink()
read csv
data <- read.csv("students.csv")setwd("C:/Users/YourName/Documents")
data <- read.csv("students.csv")data <- read.csv(file.choose())
head(data)read excel file
install.packages("readxl")
find.package("readxl")
library(readxl)
data_file = file.choose()
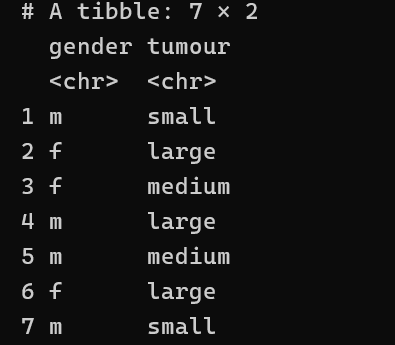
patient_data = read_xlsx(data_file)
patient_data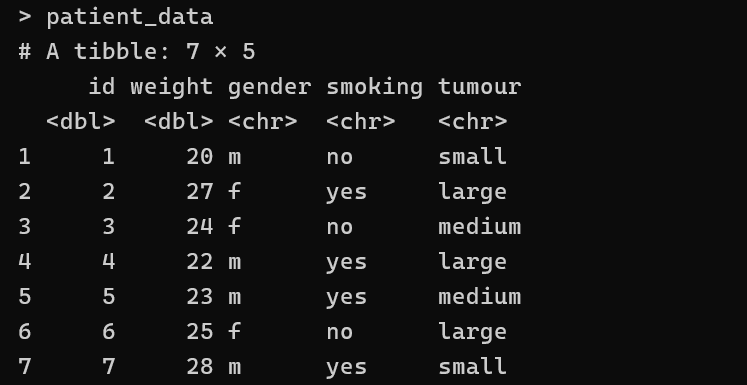
operations on data
metadata
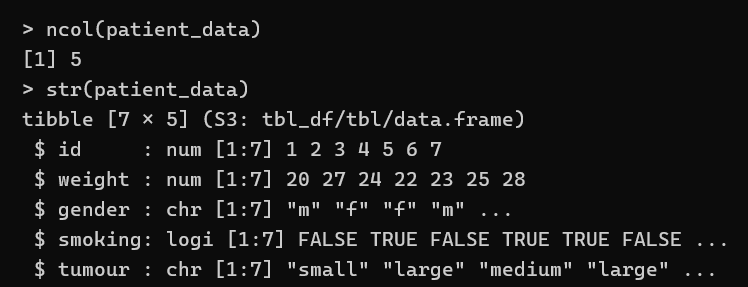
str(patient_data)
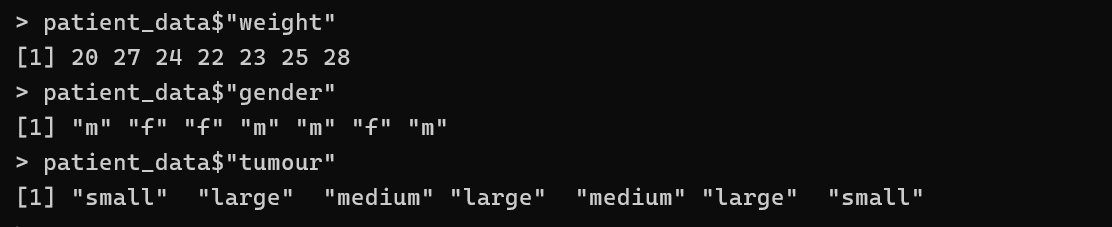
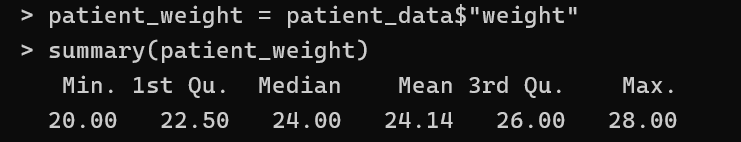
accessing individual columns
patient_data$“weight”
find first n or last n elements
head(patient_data) // first 6 rows tail(patient_data) // last 6 rows
random access to data
student_data[1:3, 1:4]
# here , first parameter is the range of rows and 2nd parameter is the range of columns
when only one parameter is passed, then its for the columns
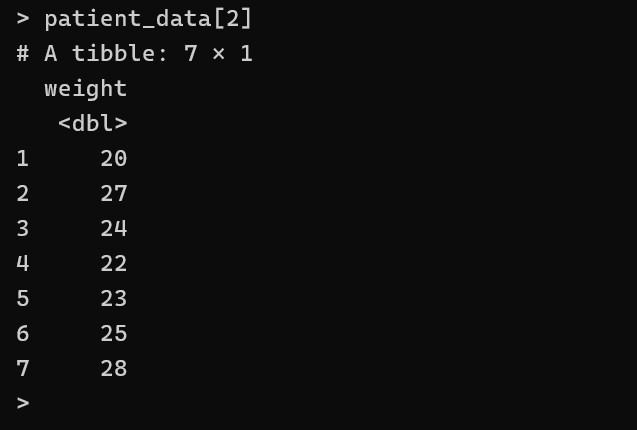
patient_data[2]
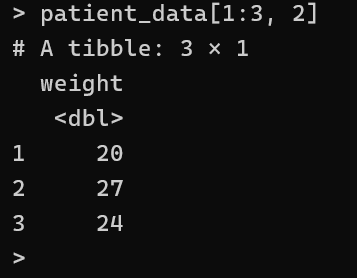
here, its is rows range and column
patient_data[1:3, 2]
you can specify multiple columns using this
patient_Data[, c(3,5)]
patient_data[c(1,4), c(1,3,5)]

patient_weight = patient_data$“weight”
using conditions
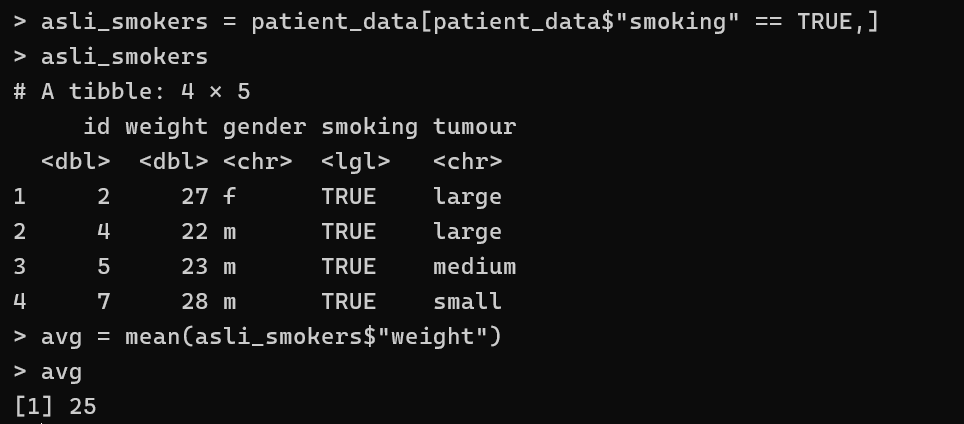
find the average weight of smokers in the given dataset
smoking_patients = patients_data[patients_data$"smoking" == TRUE , ]